The C9 system is increasingly becoming more sophisticated and intelligent in terms of its capacity to meaningfully crunch the business data it collects and provide meaningful feedback, for things such as recommended stocking levels and useful charts such as customer retention analysis. Normally, c9 users need not worry about this, it is barney's headache (actually a hobby). But there are some areas you need to be aware of, that the information you are looking at needs to be considered in light of the underlying processes used to derive it.
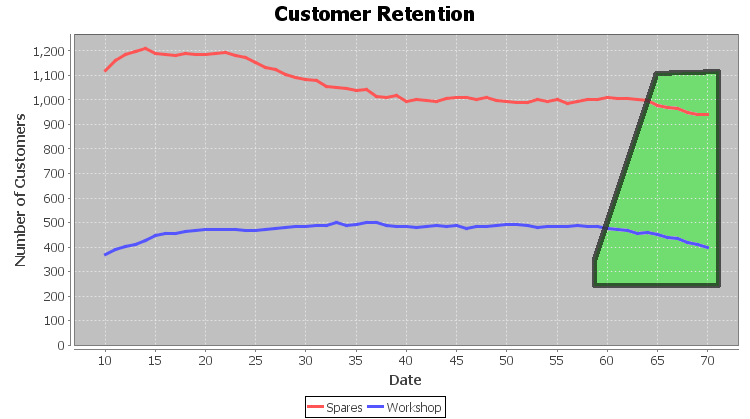
Consider a chart report; customer retention. Here is such a report taken from live data.
Note the bit I have highlighted in green. It appears as though retention is dropping off, but this is not necessarily so. It could be a statistical artefect.
Consider a customer who brings their bike in every 12 months for a service. Their last service was 3 months ago. I run the customer retention report. Obviously between 3 months ago and when he first become a customer he is counted as a retained customer. But what about today. In order to count him as a retained customer we need to assume that he will come back in 9 months. The above c9 report does indeed do this, it looks at individual customers, their return rates and makes a prediction when he comes back. If the customer comes back every 12 months like clock work then it is easy. But what happens if there is variance? i.e. he comes in after 9 months one year, 14 months the next etc etc. c9 needs to be able to cope with this variance and make a reasonable prediction. But it is only a prediction; so the tail end of the graph is somewhat inaccurate. Also, consider customers c9 has only seen once, currently c9 lacks a means/model to make a guess whether or not they are new retained customers or once off customers only. So never read too much into the tail end of a graph such as this one.


